
How Healthy is Your California Neighborhood?
You can easily find out using CalEnviroScreen, an online environmental health screening tool that scores each of the state’s 8000 census tracks for pollution burden and population characteristics.
Gina Solomon, Deputy Secretary for Science and Health at the California EPA, was a recent WCAHS seminar speaker and explained that each California census tract has been scored for pollution burden and population indicators of environmental health. Pollution indicators include ozone, particulate matter, diesel, drinking water, pesticides, toxic releases, traffic, cleanups, and groundwater. Population characteristics include age, asthma, low birth weight, low education, linguistic isolation, poverty, and unemployment.
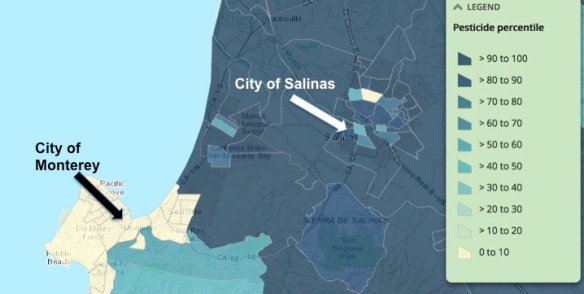
To see how your census track is doing, click on the pollution burden or population characteristic map, find the particular census track you are interested in, and then click on an individual pollution indicator or population characteristic tab. Each census track is color coded. Darker colors indicate a greater score and relatively higher pollution burden / population vulnerability than areas with lighter colors and lower scores. For example, the pesticide burden for the City of Monterey is much less (light color) than the area surrounding the City of Salinas (dark color), which is heavily farmed and famous for fruits and vegetables.
CalEnviroScreen was created to help implement a state law (SB 535) requiring 25% of proceeds from the state’s cap-and-trade auctions be invested in projects that benefit disadvantaged communities, including 10% for projects located within these areas. Thus, CalEnviroScreen allows the state to identify California communities with the greatest cumulative exposure to pollution and send state resources to those who need it most.
Lucky for us, CalEnviroScreen is also a great resource for public health researchers interested in a specific problem or location or how multiple environmental stressors affect a community. Dr. Solomon pointed out that many of California’s most disadvantaged communities are in rural, agricultural areas, and CalEnviroScreen can provide WCAHS researchers with a wealth of information.